A fitness tracker for Obsidian
I don't really enjoy the gym. I suppose that perhaps my fascination with biology ends at the cell membrane, because the jargon of muscle groups and their biomechanics to makes my eyes glaze over and my brain scramble for the exits. Fortunately for me, my wife, who took a minor in anatomy as part of her biology degree and actually enjoys the gym, was kind enough to design a routine I can follow without having to think about it too hard. She wrote down the location of the machine, the settings, and the goofy motions I'm supposed to perform with it. I just do the thing, and when it starts to feel easy, I cross out the number in front of "kilograms" and write in the next bigger number on the machine. I don't think I'd have been able to get started without her simplifying it for me! Her gym routine notes looks like the maintenance schedule of a high performance military aircraft to me.
Anyway, eventually the list she wrote for me turned into Obsidian note, and usual thing started to happen. It became a checklist. Then I started automating adding new checkboxes for each workout. The automation started to get more elaborate. After two years of embroidery, it's basically grown into a fitness tracker app. I decided to tidy it up and share it.
So, this is a workout tracking system for built around a single hub note. I designed this with these ideas in mind :
- I don't want to think about anything while I'm at the gym. I just want to check off tasks.
- I don't want to spend a lot of planing. I just want to put the numbers into a table.
- When I make charts and stats, I want them to update automatically when I finish a workout.
So, it my tracker works like this : Press a button to create a workout note pre-filled from your current targets, check off exercises as you go, press a button to finish. The scripts create new workouts based on whatever is in the workout table and writes structured frontmatter into each workout note automatically so the history is queryable with Dataview and Charts.
You can get code from the Github repo.
It's automated enough to make routine days easy, but flexible enough not to make struggle days worse.
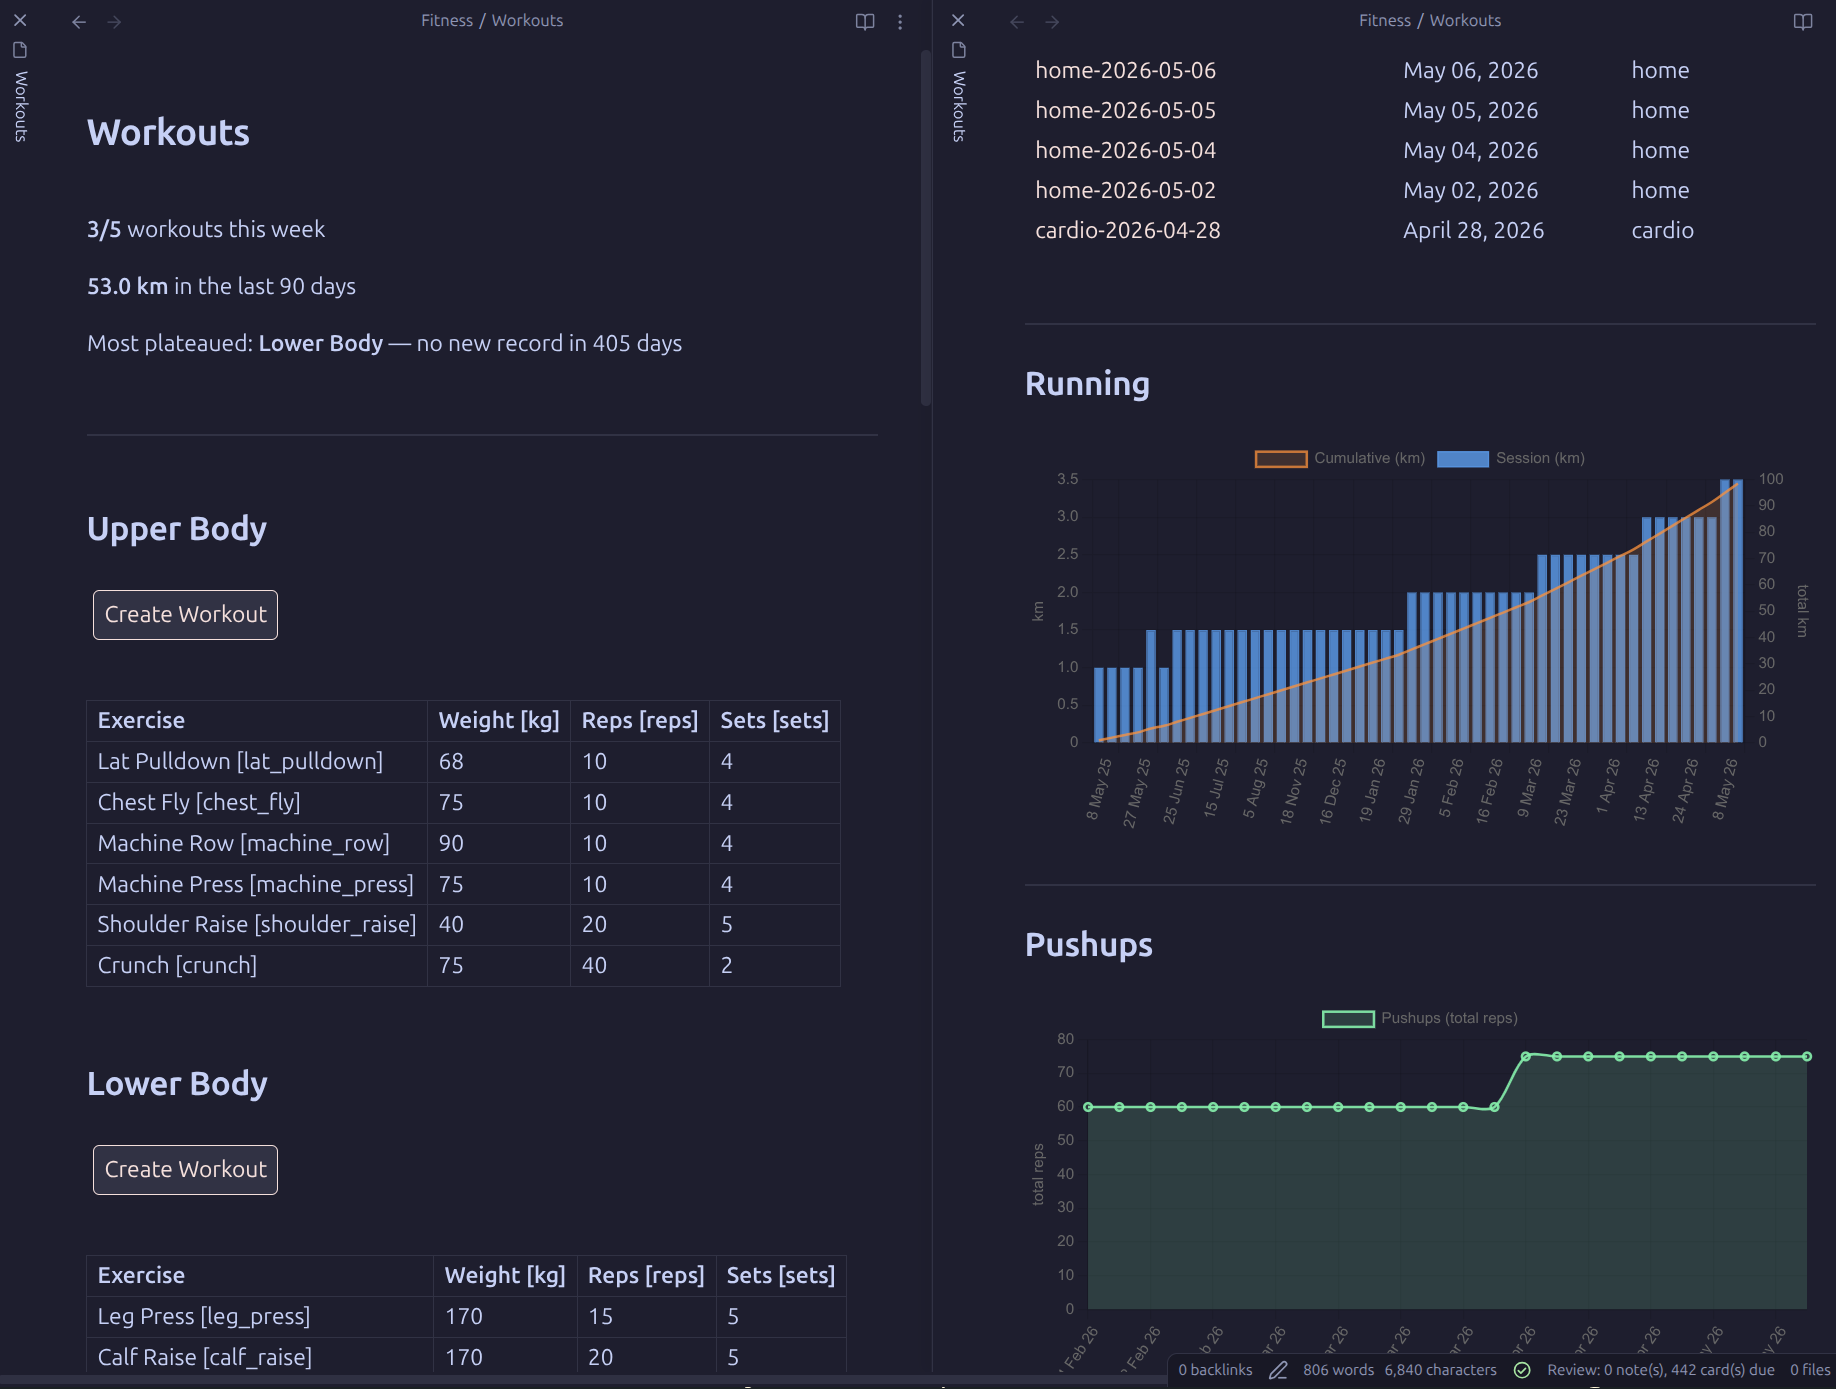 The hub note — session count, running total, and plateau alert at the top; one button per workout type; progress charts below.
Plugins
| Plugin | Author | Purpose |
|---|---|---|
| Dataview | blacksmithgu | Querying workout history; rendering charts via DataviewJS |
| Templater | SilentVoid13 | Running the create/finish scripts |
| Buttons | shabegom | One-tap workout creation from the hub note |
| Tasks | obsidian-tasks-group | Checkbox state tracking and completion timestamps |
| Charts | phibr0 | Rendering progress charts |
All are available in the Obsidian Community Plugins browser.
Dataview
- Enable JavaScript Queries — on (required for DataviewJS blocks and charts)
- Enable Inline Queries — optional, not used by this system
Templater
- Template folder location — set to your
Templates/folder - Script files folder location — set to
Templates/Scripts/ - Trigger Templater on new file creation — on (this is what fires the create script when the Buttons plugin creates a new note)
Buttons
No special settings required beyond installation.
Tasks
No special settings required. The system uses [x] / [-] checkbox states and the ✅ YYYY-MM-DD completion stamp that Tasks writes automatically.
Charts
No special settings required beyond installation.
Installation
Fetch the code from the Github repo. You can clone it directly into your vault directory, and it should just work.
- Copy the following into your vault, preserving the folder structure :
Fitness/
  Workouts.md
  Workouts/          ← workout notes are created here automatically
Templates/
  Create Upper Body Workout.md
  Create Lower Body Workout.md
  Create Cardio Workout.md
  Create Home Workout.md
  Scripts/
    createWorkout.js
    finishWorkout.js
- Install and enable all five plugins listed above.
- In Templater settings, set Template folder to
Templates/and Script files folder toTemplates/Scripts/. - Enable Trigger Templater on new file creation in Templater settings.
- Open
Fitness/Workouts.md. The three bold summary lines at the top will populate once you have workout notes in the folder.
Designing workouts
All workout types are defined in Workouts.md. Each type is a ## section containing a table of exercises. Add a row to the table in the relevant section. The column header format is :
| Exercise | Weight [kg] | Reps [reps] | Sets [sets] |
The bracketed annotation ([kg], [reps], etc.) defines the frontmatter key suffix that will be written for that column. The first column is always the exercise name, and its bracketed annotation is the exercise key used throughout the system:
| Lat Pulldown [lat_pulldown] | 68 | 10 | 4 |
Blank cells produce no frontmatter key, which is how optional columns work (e.g. Planks has a duration but no reps).
To add a new workout type :
-
Add a new
##section toWorkouts.mdwith a table following the format above. -
Create a one-line shim template in
Templates/namedCreate <Type> Workout.md:
<%%* tR += await tp.user.createWorkout(tp, 'Type Name') -%%>
where 'Type Name' exactly matches the ## heading in Workouts.md.
- Add a button to the new section in
Workouts.md:
```button
name Create Workout
type note(Fitness/Workouts/<type-name>) template
action Create <Type> Workout
templater true
```
The filename prefix is derived automatically from the section heading ('Lower Body' → lower-body). createWorkout.js renames the placeholder file to the correct dated name (e.g. lower-body-2026-05-14.md) before writing any content, so no date expression is needed in the button.
Columns and units
The unit in each column header becomes part of the frontmatter key :
| Header | Key suffix | Example key |
|---|---|---|
Weight [kg] |
_kg |
lat_pulldown_kg |
Reps [reps] |
_reps |
lat_pulldown_reps |
Sets [sets] |
_sets |
lat_pulldown_sets |
Distance [km] |
_km |
running_km |
Speed [km/h] |
_km_h |
running_km_h |
Duration [s] |
_s |
planks_s |
Slashes in units are converted to underscores (km/h → km_h).
How to do a workout
- Open
Fitness/Workouts.mdand press the Create Workout button for the type you want. A new dated note is created inFitness/Workouts/and opened automatically.
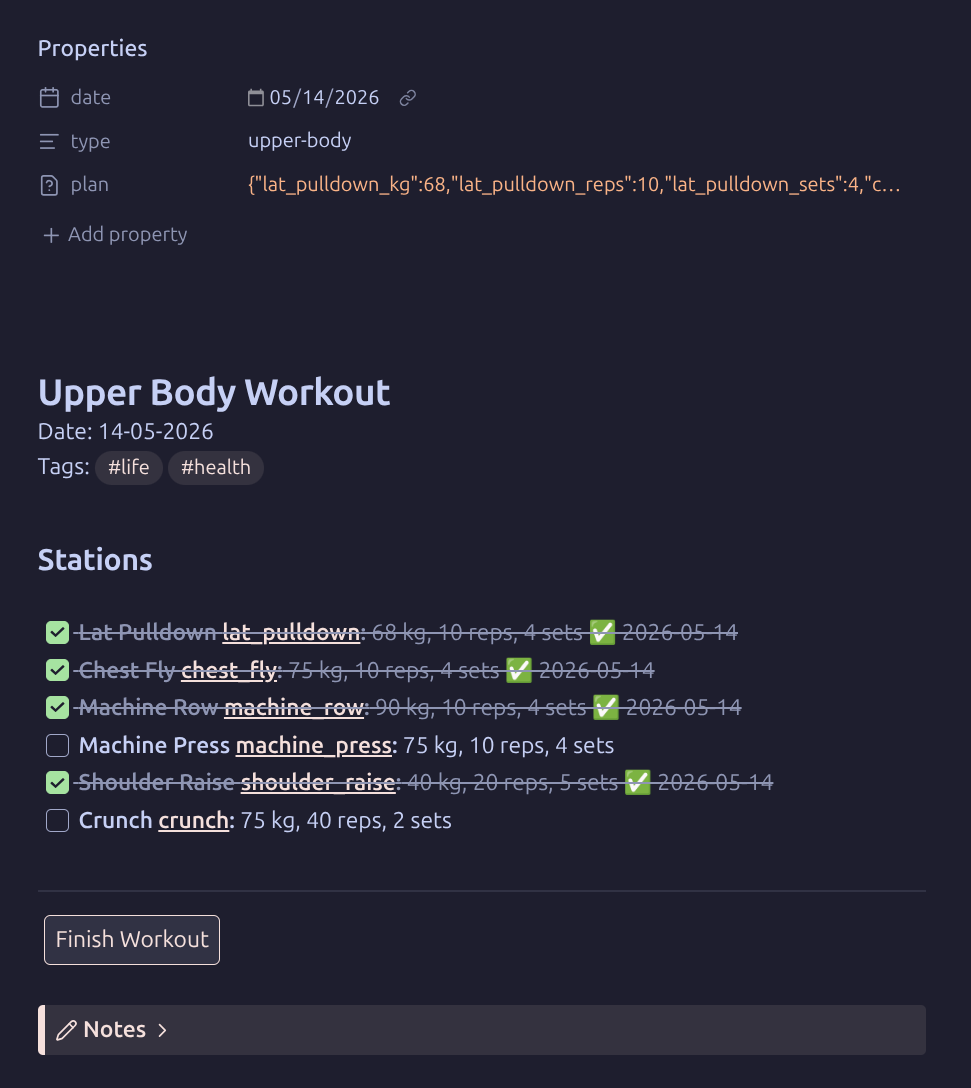 A freshly created workout note — each station pre-filled from your current targets in
 Workouts.md.
- Work through your exercises. Each station is a checkbox pre-filled with your target values :
- [ ] **Lat Pulldown [lat_pulldown]:** 68 kg, 10 reps, 4 sets
Check the box when done. If you deviated from the target (different weight, fewer sets), edit the values on the line before checking.
-
When finished, press Finish Workout. The script:
-
Reads every checked item and writes the actual values to
done:frontmatter - Marks any unchecked items as
[-](cancelled) - Expands the Notes callout and records any deviations from
plan:or cancelled exercises
The plan: frontmatter (written on creation) records what you intended. The done: frontmatter (written on finish) records what you actually did. Differences between the two are deviations.
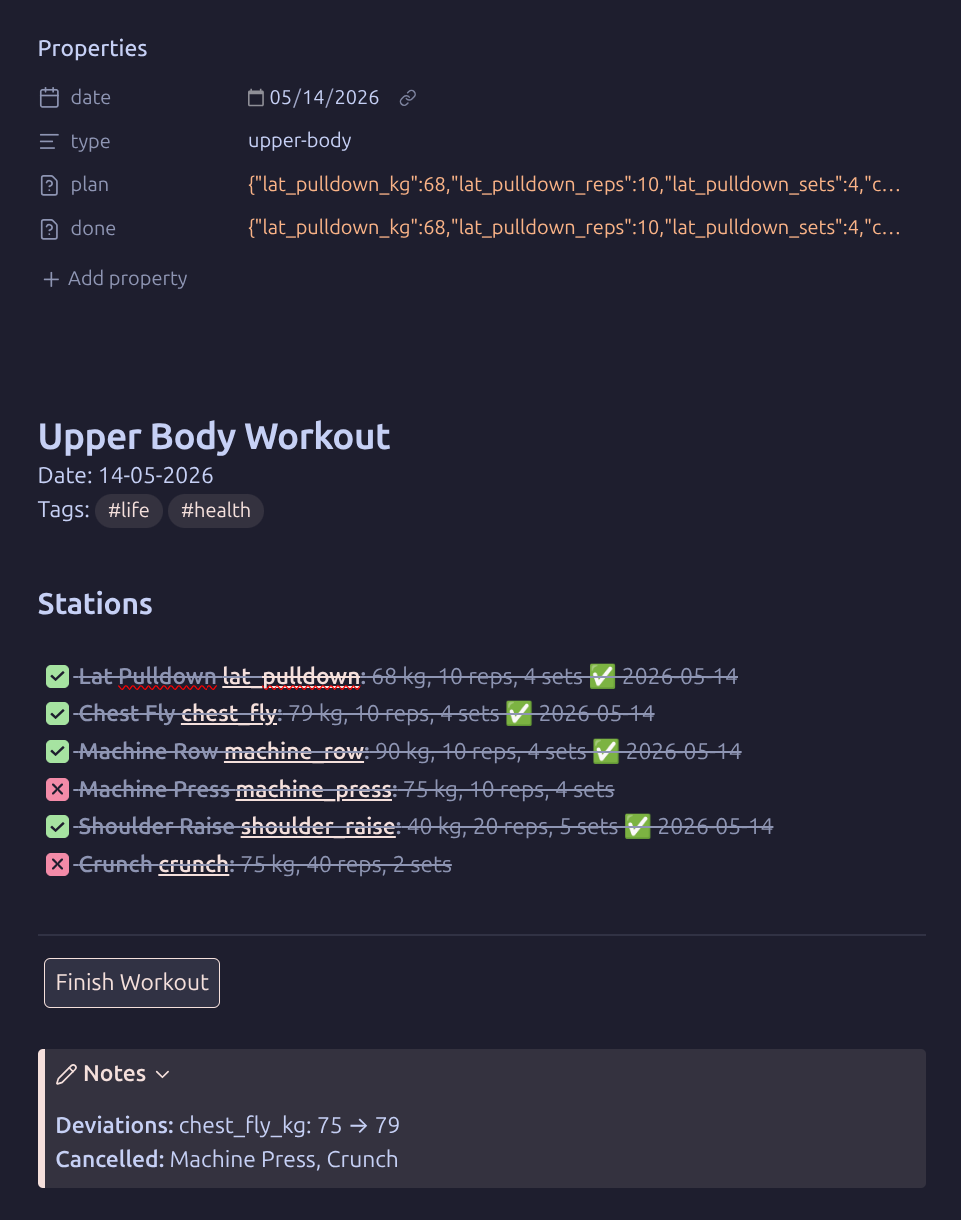 After pressing Finish Workout — checked items are written to
 done: frontmatter, cancelled items marked [-], and any deviations summarized in the Notes callout.
Frontmatter structure
The metadata is created automatically, so you don't have to actually do anything for this to work. Each workout note has this structure :
---
date: 2026-05-14
type: upper-body
plan:
  lat_pulldown_kg: 68
  lat_pulldown_reps: 10
  lat_pulldown_sets: 4
  chest_fly_kg: 75
  ...
done:
  lat_pulldown_kg: 70      # you went heavier
  lat_pulldown_reps: 10
  lat_pulldown_sets: 4
  chest_fly_kg: 75
  ...                      # cancelled exercises are absent from done:
---
typeis the kebab-case prefix derived from the section headingplanis set on creation;doneis set on finish- A key present in
planbut absent fromdonemeans that exercise was cancelled - A value in
donethat differs fromplanis a deviation
Querying data with DataviewJS
Because each workout has its data encoded in the YAML frontmatter, it is pretty easy to query using DatavewJS. The basic pattern for querying looks like this :
const pages = dv.pages('"Fitness"')          // all notes in Fitness/ and subfolders (recursive)
    .where(p => p.type === "upper-body" && p.done)
    .sort(p => p.date, "asc")
    .array();
Nested YAML objects (plan:, done:) are accessible as plain properties :
p.done.lat_pulldown_kg   // number
p.plan.lat_pulldown_sets // number
Some common patterns
All values for one exercise over time :
pages.map(p => ({ date: p.date, kg: p.done.lat_pulldown_kg }))
All-time PR for a field :
Math.max(...pages.map(p => p.done.lat_pulldown_kg ?? 0))
Total volume (reps × sets) per session :
pages.map(p => Number(p.done.pushups_reps) * Number(p.done.pushups_sets))
Cumulative total :
let cum = 0;
const cumulative = values.map(v => (cum += v));
Sessions in the last N days :
const cutoff = dv.date("today").minus({ days: 90 });
dv.pages('"Fitness"').where(p => p.date >= cutoff)
Rendering a chart
To render a chart, pass a Chart.js config object to window.renderChart() :
window.renderChart({
    type: "line",
    data: {
        labels: pages.map(p => p.date.toFormat("d MMM yy")),
        datasets: [{
            label: "Distance (km)",
            data: pages.map(p => p.done.running_km),
            borderColor: "rgba(37, 99, 235, 0.9)",
            backgroundColor: "rgba(37, 99, 235, 0.15)",
            fill: true,
            tension: 0.3,
            pointRadius: 3,
            borderWidth: 2
        }]
    },
    options: {
        scales: {
            y: { min: 0, title: { display: true, text: "km" } }
        }
    }
}, this.container);
Tips :
- Use
rgba()for colors — CSS variable approaches are unreliable in DataviewJS context - Check
document.body.classList.contains("theme-dark")to pick light/dark variants - For dual-axis charts, assign
yAxisID: "y"andyAxisID: "y1"to datasets and define both axes inoptions.scales - Set
order: 1on the dataset you want rendered on top (lower = on top) pointRadius: 0on lines with many data points avoids visual clutterautoSkip: truewithmaxTicksLimiton the x-axis prevents label crowding